Video help
Chart of accountsChart of accounts
In this video:
- Chart of accounts - allocations
- Chart of accounts - renaming
- Rounding
- Outputs - Internal review report
Jump to a specific point in the video with the chapters button in the video.
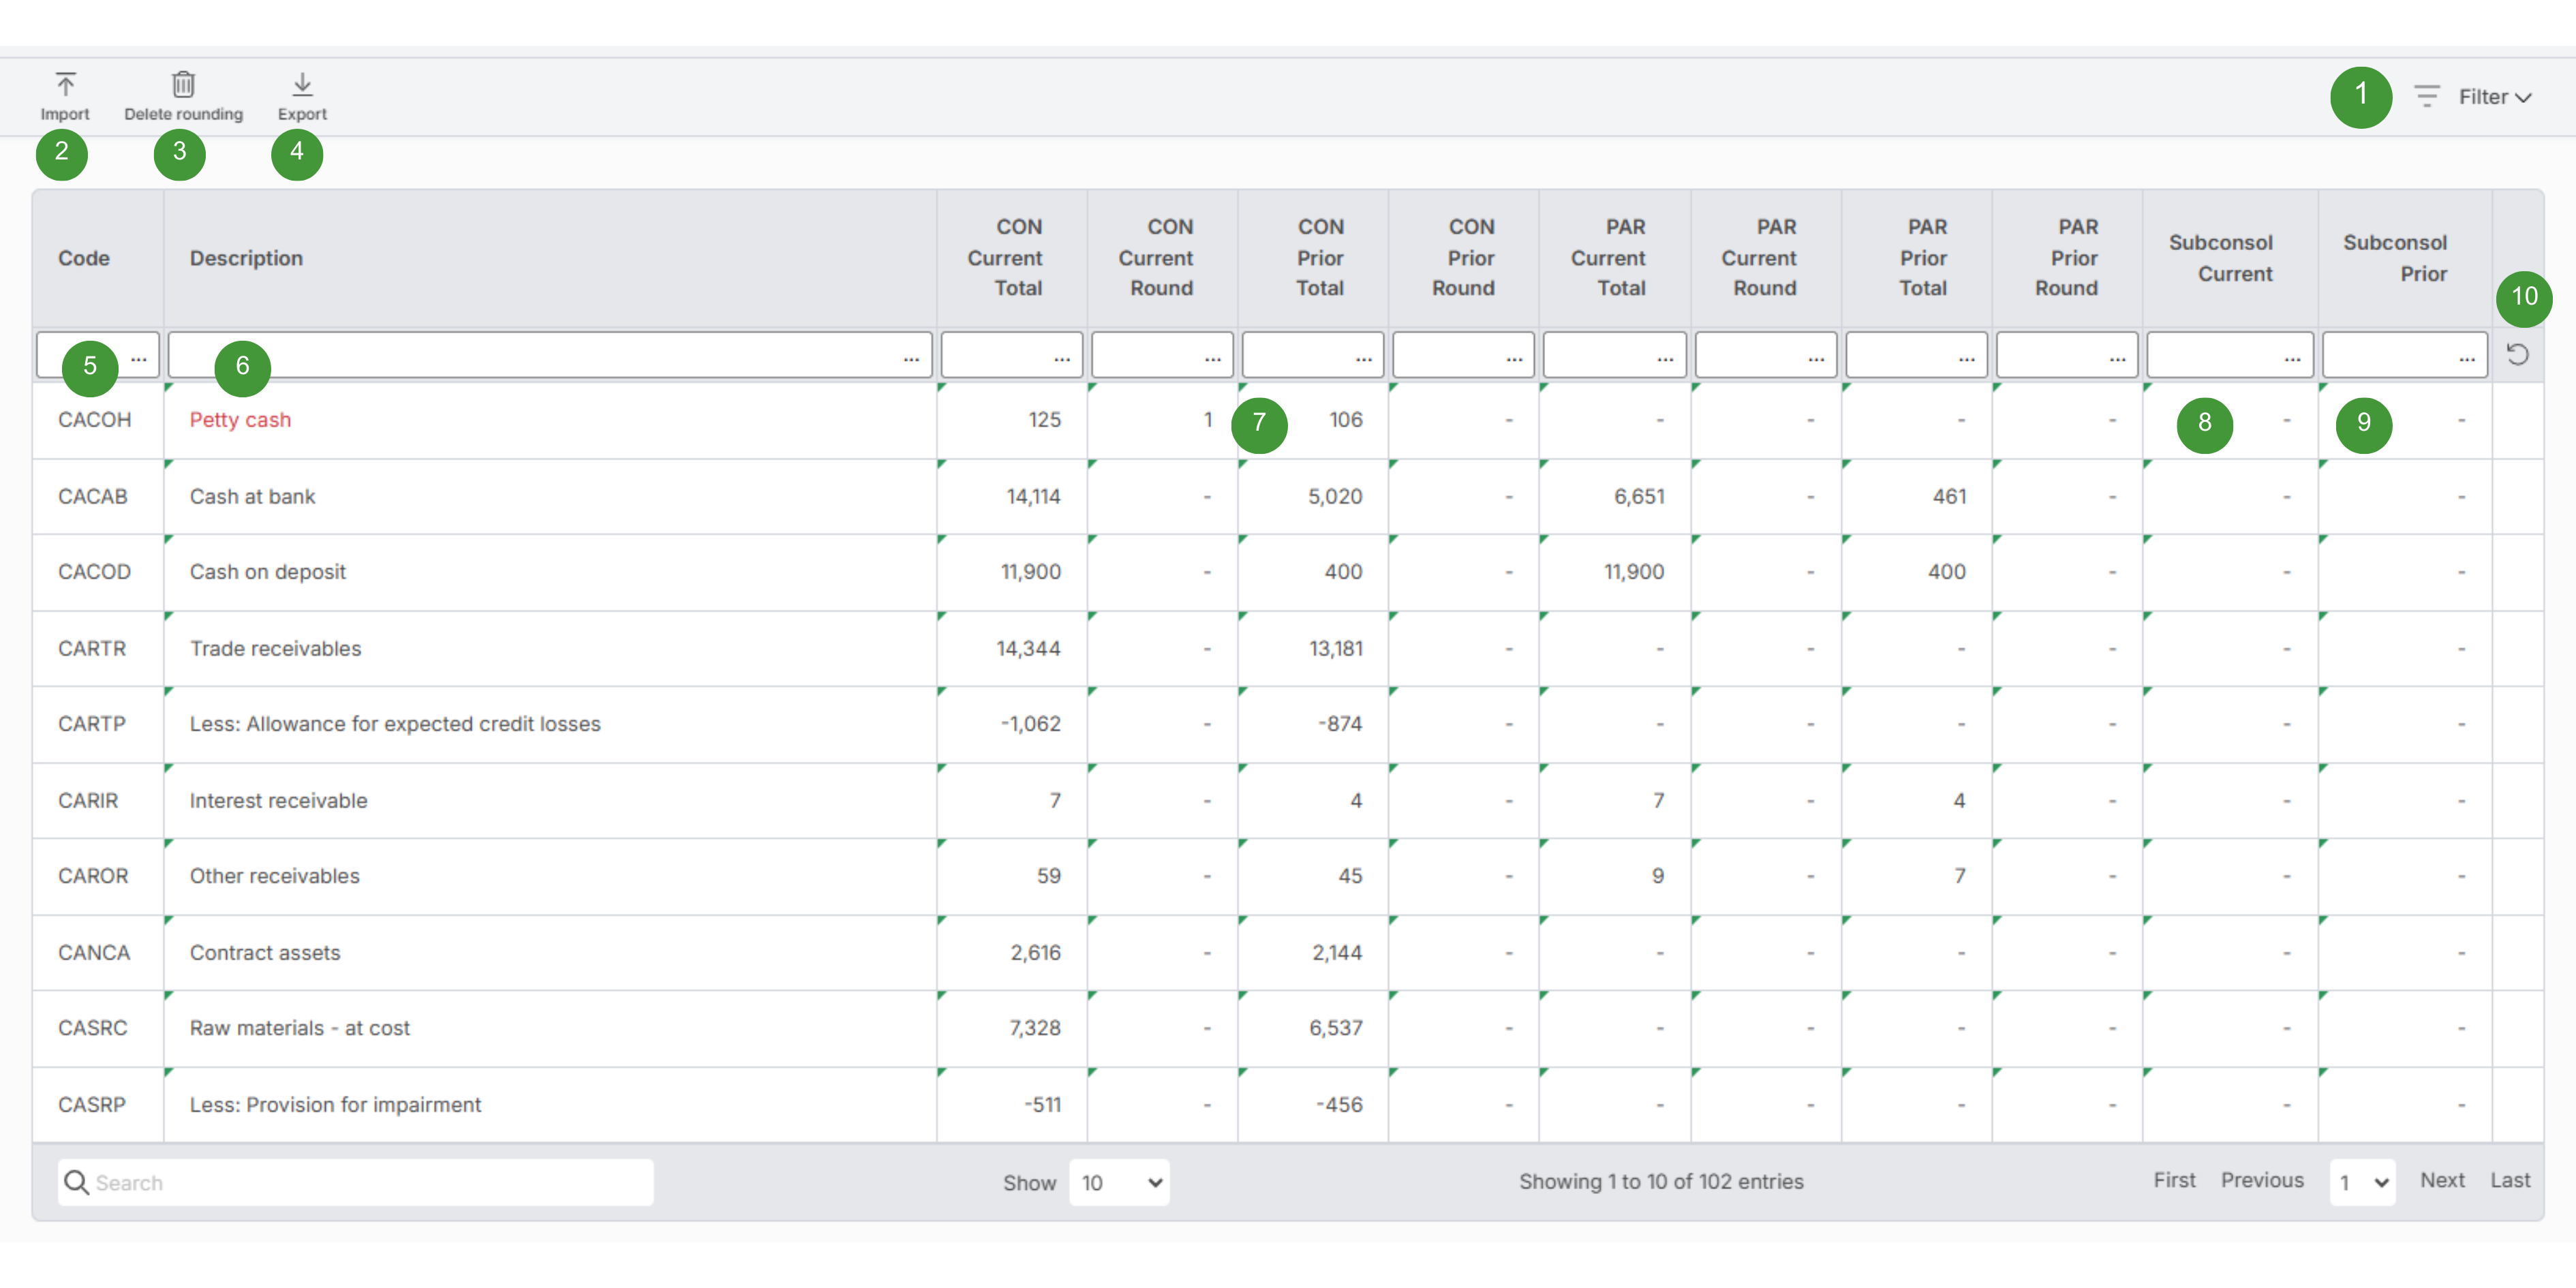
Chart of accounts features
| Option | Function | Notes | |
| 1 |
Filter |
|
|
| 2 |
Import |
Import customised descriptions from Excel or a different report |
|
| 3 |
Clear rounding |
Deletes all rounding |
|
| 4 |
Export |
Export to Excel |
|
| 5 |
Code |
Chart of accounts code |
|
| 6 |
Description |
Chart of accounts description |
|
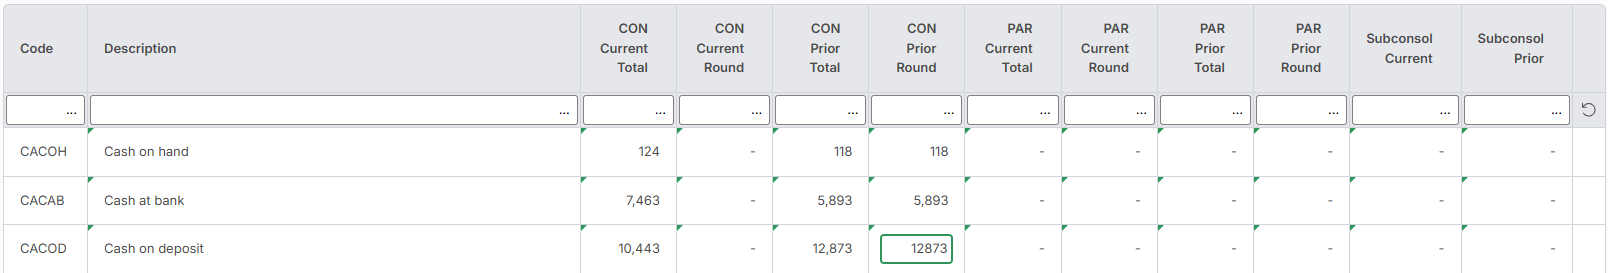
| 7 |
Round any account, in any of the rounding (Round) or Total columns |
|
|
| 8 |
Subconsol Current |
Current subconsolidation total |
|
| 9 |
Subconsol Prior |
Prior subconsolidation total |
|
| 10 |
Reset description |
Resets the description(s) |
|
Chart of accounts import
- Click Inputs > Chart of accounts
- Click Import
- Select the file to import
- Click OK
- This will update the chart of accounts descriptions as follows:
- Source file has a custom description, current report does not have a custom description, the description will be updated in the current report
- Source file and current report have custom descriptions, the description will be updated in the current report
- Source file does not have a custom description, current report does have a custom description, the description will not be updated
The required format of the import file is:
| Column A | Column B | |
|
Column |
Allocation |
Description |
|
Required |
Required |
Required |
|
Notes |
5 characters |
150 characters maximum length |
The following image shows a valid sample file:

Import chart of accounts descriptions from a different report
- Click Inputs > Chart of accounts
- Click Import
- Select to import from a different report
- Select the entity and report containing to import from
- Click OK
- This will update the chart of accounts descriptions as follows:
- Source report has a custom description, current report does not have a custom description, the description will be updated in the current report
- Source and current report have custom descriptions, the description will be updated in the current report
- Source report does not have a custom description, current report does have a custom description, the description will not be updated
- Click Inputs > Import report
- Set Chart of Accounts edited descriptions to Yes
- Click Import report and follow the prompts
- This will update all chart of accounts descriptions
How totals are calculated for Interim Reports
For Interim Reports, as the comparative period covers two different periods (generally, statement of profit or loss and other comprehensive income being 12 months ago and the statement of financial position being 6 months ago), the interim performance and the prior position balances are ignored.
When preparing an Interim Report, the 'Prior' totals are calculated as follows:
- Statement of profit or loss: aggregate of 'Trial balance' and 'Adjustments' from the prior columns
- Statement of financial position: aggregate of 'Trial balance' and 'Adjustments' from the annual columns
For Interim Reports, as an alternative to importing trial balances and entering adjustments into the 'Annual' columns, to populate the statement of financial position, comparative balances can be entered via Rounding in the 'Prior Round' columns in Inputs > Chart of accounts.
For example: